BI SERVICES
A new generation
of Power
BI Dashboards
and reports
Design. Performance. Quality.
Nous 5-steps
lean dashboard process
CLIENT PROBLEM
Dashboard - Concept
Client - Feedback
Define Need
Think impact: What are the clients problems and how do we offer a solution?
Structure Dataset
Think Architecture: What are the data sources to be used on the dashboard?
Conduct Analyses
Think Audience: Who are the end-users of this dashboard?
UX | UI Design
Think Behaviour & Experience: What is the best possible design layout for the users?
Develop Solution
Think Performance: How can we tell a story with the data by harnessing its design?
What You Get
Branding
Dashboards are branded according to each project and the respective guidelines. Every
style and mood is picked to represent the right story for your audience.
Insights
Not all Data are Insights. It depends on the audience and the dashboard concept. Nous
helps you to determine the core insights your business needs and pair them with the
right visuals for the best interpretation and interaction.
Story
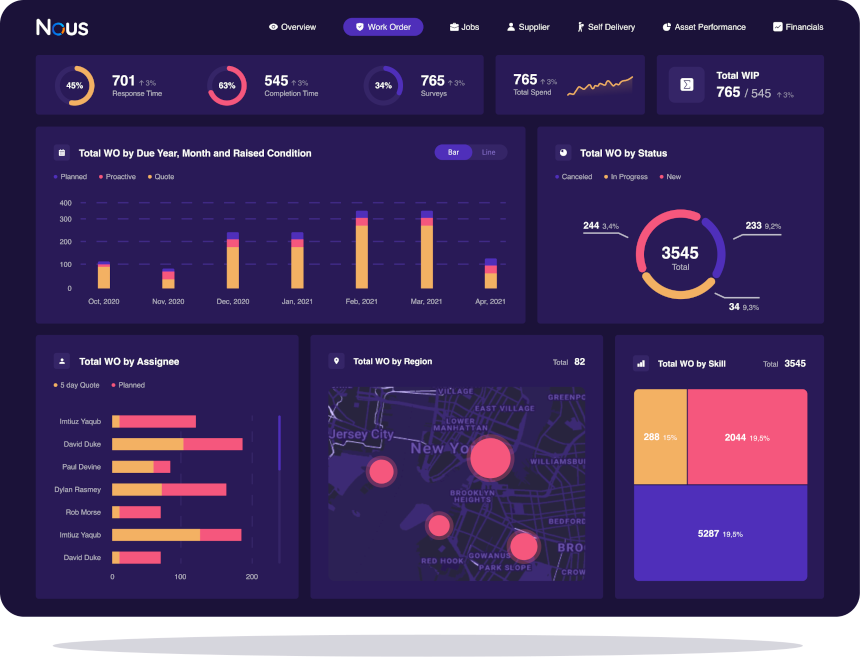
Dashboards and reports can tell one hell of a story. The sequence of insights, vibrant
colours, size of modules and interactive discovery are some of the methods we use.
Data Connectivity
Live Connection
With our in-house Power BI connectors you can integrate data from a range of sources and
refresh data on your system in real-time.
Centralize Data
Power BI is a robust ETL solution for transforming and combining multiple data sources
on a single platform. We gather all of your data and incorporate it into a
one-of-a-kind, streamlined dashboard that works for your brand.
APIs Design
Get quick access to over 5,000 data sources to help you improve the content of your
dashboards.
UX/UI Design
Beauty leads to Engagement
Unfortunately, some experts and developers disagree. Then again, that is why our clients
hire us. Beauty and visual appeal are the way to go if you want attention and
engagement.
Mobile is the Key
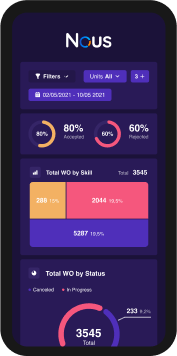
All of our dashboards are available in Mobile format, on demand. You can access them
through the Power BI app or directly on the dashboard link with the mobile adapted
version.
Simplicity is a Talent
Dashboard designs must be simple and straigtforward. When there is a mountain of data
and multiple stakeholders involved, things can get complicated. We take an unbiased
approach to data, so you know you are getting the true story.


